Boardgamegeek is board game nirvana for geeks, nerds and the occasional cool person. It is like Wikipedia to your science.
This website holds a massive library of more than 90,000 games, with about 800,000 registered users and more than 150,000 active monthly users.
What is more impressive about this site is how open the data is. You can view anyone’s boardgame collection, how they have rated their games, how often they have been playing and even their wishlist of games to buy and/or try. The notion that this website is like the swiss army knife of the boardgaming world makes it easy to entrust it with everything boardgame-related in one’s life.
Yummy, yummy ratings…
With the wealth of games and the dearth of time, a good boardgame recommender seems like the ideal solution to helping one choose wisely. The beauty of Boardgamegeek (or BGG for short) is its rating system. Users can rate games on a scale of 1 to 10. There is even a rubric to suggest how you might want to rate your games. It is entirely up to you however and some users even give ratings to 2 decimal places!
 Rate your games accordingly
What’s more, the ratings are colour coded on the webpage for quick identification.
Bloody-red belongs to a rating of 1 and it gets lighter till rating 5 where it turns purple. The transition from a sky-blue 7-rating and a light-green 8-rating is distinct, only to get to its darkest shade of green at 10.
Scraping and calling
There exists a python module that allows one access to BGG’s XML APIs via pythonic methods and classes. It unfortunately is not versatile enough for my needs. I will be scraping the page of the website where I sort all games in descending order of number of ratings. This means the game where most users have rated it will be right at the top. I will then scrape this page to gather the list of games up till the point where I hit the game with just less than 1000 ratings. This will be my game list dataset.
I will then be making API calls to gather the rating data for each game in the game list, as well as the users that have provided them. This will become my ratings list. I will then process this ratings list into an N x M matrix of N rows of users by M columns of games. The values in the matrix will be the ratings provided by users for games.
Getting ready for the big scrape
We will import the usual python modules for data science work along with Beautiful Soup for HTML extraction and sleep to make sure we don’t be a nuisance to the BGG servers.
import requests
from bs4 import BeautifulSoup
import matplotlib.pyplot as plt
import seaborn as sns
import pandas as pd
import numpy as np
import pickle
from time import sleep


%config InlineBackend.figure_format = 'retina'
%matplotlib inline

sns.set_style('white')
In order to make sure that our http requests get sent even though we get disconnected from the network, I have here a function that helps to make our requests robust.
def request(msg, slp=1):
    '''A wrapper to make robust https requests.'''
    status_code = 500  # Want to get a status-code of 200
    while status_code != 200:
        sleep(slp)  # Don't ping the server too often
        try:
            r = requests.get(msg)
            status_code = r.status_code
            if status_code != 200:
                print "Server Error! Response Code {}. Retrying...".format(r.status_code)
        except:
            print "An exception has occurred, probably a momentory loss of connection. Waiting one seconds..."
            sleep(1)
    return r
The Scrape
Looking at the list of games sorted in descending order, I will extract games that have at least 1000 ratings. This is so that I would have sufficient information about each game to generate the recommendations.
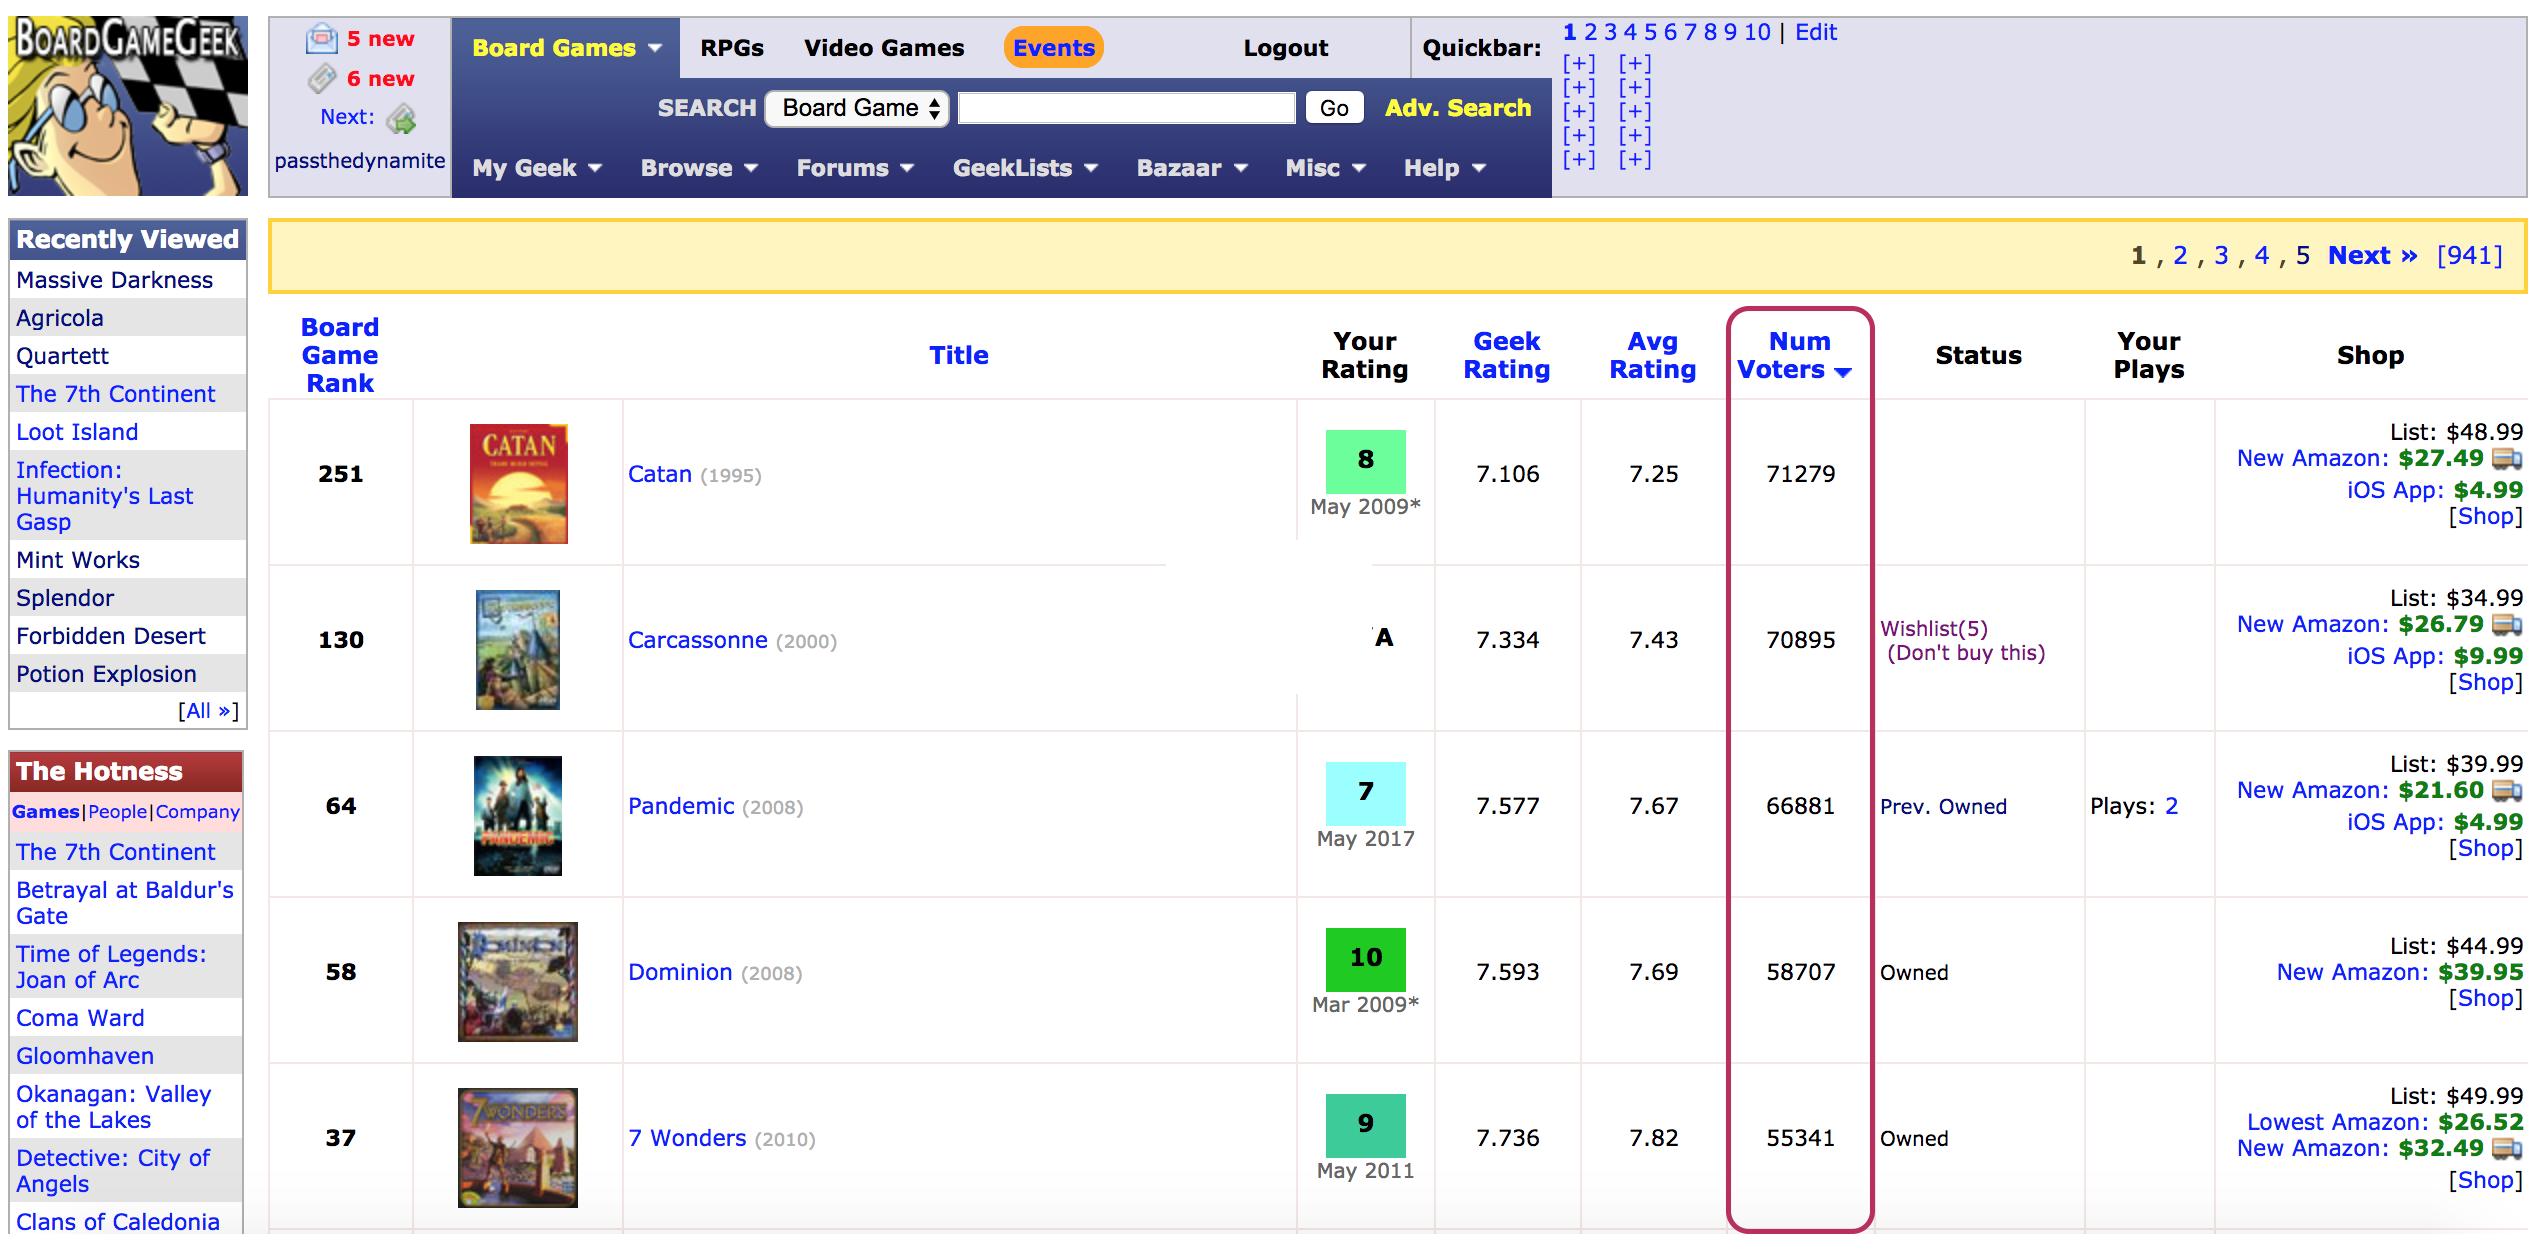 Column highlighted in red indicates number of ratings a game has. Page taken from the BGG.com website
Making sense of the HTML code
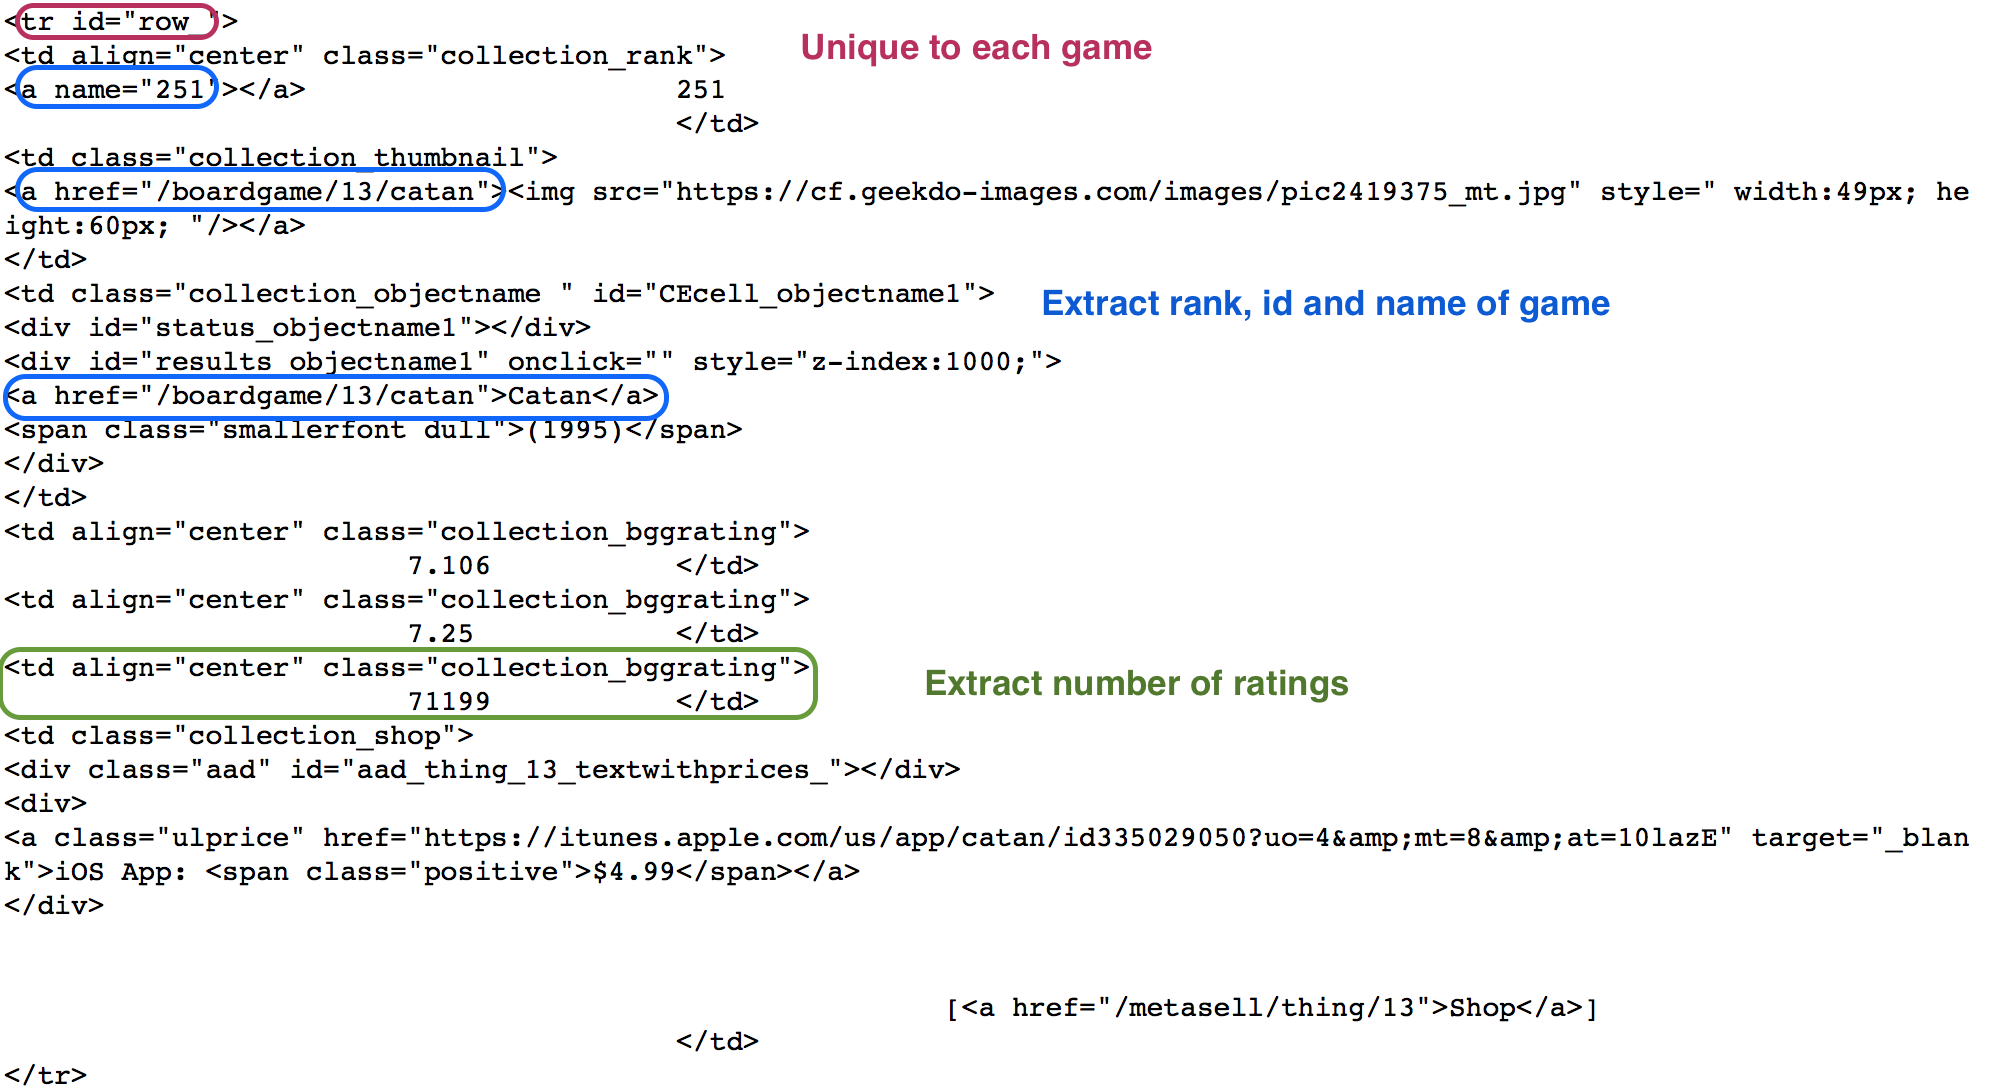
In the following image, you’ll see how I deconstructed the HTML in order to get what I want from each game, namely the rank, ID, name of game as well as the number of ratings.
Each game is first encapsulated around the <tr id='row_'> tags, so we make sure we look out for those.
Next, we extract the rank, ID and name of each game by identifying the next 3 </a> tags and perform some string processing techniques.
Finally, we acquire the number of ratings by looking at all <tr> tags with class attribute “collection_bggrating” and perform some more string processing techniques on them.
 Output of scraping that makes sense by reading together with code below
The commented code for getting the scraping results is right here:
# Initialize a DF to hold all our scraped game info
games = pd.DataFrame(columns=["gameid", "gamename", "nratings","gamerank"])
min_nratings = 100000 # Set to a high number to satisfy while condition
npage = 1

# Scrape successful pages in the results until we get down to games with < 1000 ratings each
while min_nratings > 1000:
    # Get full HTML for a specific page in the full listing of boardgames sorted by
    r = request("https://boardgamegeek.com/browse/boardgame/page/{}?sort=numvoters&sortdir=desc".format(npage))
    soup = BeautifulSoup(r.text, "html.parser")

    # Get rows for the table listing all the games on this page. 100 per page
    table = soup.find_all("tr", attrs={"id": "row_"})
    # DF to hold this page's results
    temp_df = pd.DataFrame(columns=["gameid", "gamename", "nratings", "gamerank"], index=range(len(table)))

    # Loop through each row and pull out the info for that game
    for idx, row in enumerate(table):
        links = row.find_all("a")
        try:
            gamerank = links[0]['name'] #Get rank of game
        except Exception: # Expansions will not have ranks and will be recorded as NaN rows in our dataframe
            continue
        gamelink = links[1]  # Get the relative URL for the specific game
        gameid = int(gamelink["href"].split("/")[2])  # Get the game ID by parsing the relative URL
        gamename = links[2].contents[0]  # Get the actual name of the game as the link contents

        ratings_str = row.find_all("td", attrs={"class": "collection_bggrating"})[2].contents[0]
        #split on white space to leave list of string of number, join on empty space then change to int datatype
        nratings = int("".join(ratings_str.split()))
        temp_df.iloc[idx, :] = [gameid, gamename, nratings, gamerank] #Add to temp_df

    # Concatenate the results of this page to the master dataframe
    min_nratings = temp_df["nratings"].min()  # The smallest number of ratings of any game on the page
    print "Page {} scraped, minimum number of ratings was {}".format(npage, min_nratings)
    games = pd.concat([games, temp_df], axis=0)
    npage += 1
    sleep(2) # Keep the BGG server happy.
The output helps keep our sanity in check and ensures we are on the right track.
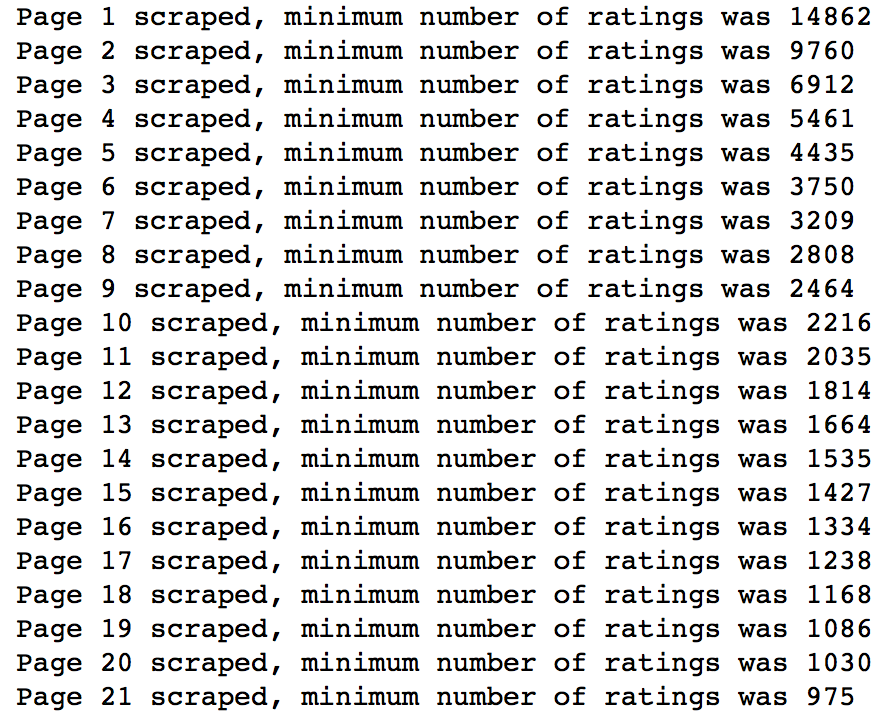 Notice we actually reached slightly below 1000 in our final total minimum ratings but that’s ok. More data never did harm anyone.
Preprocessing our games dataset
From our output, we know that we have scraped 21 pages and if you were to refer to the image of the BGG website, the top right corner indicates that there are 941 pages of games. It might seem that we have only scratched the surface, but if the pareto principle serves us correctly, this small percentage of games should substantially hold majority of the ratings on the website.
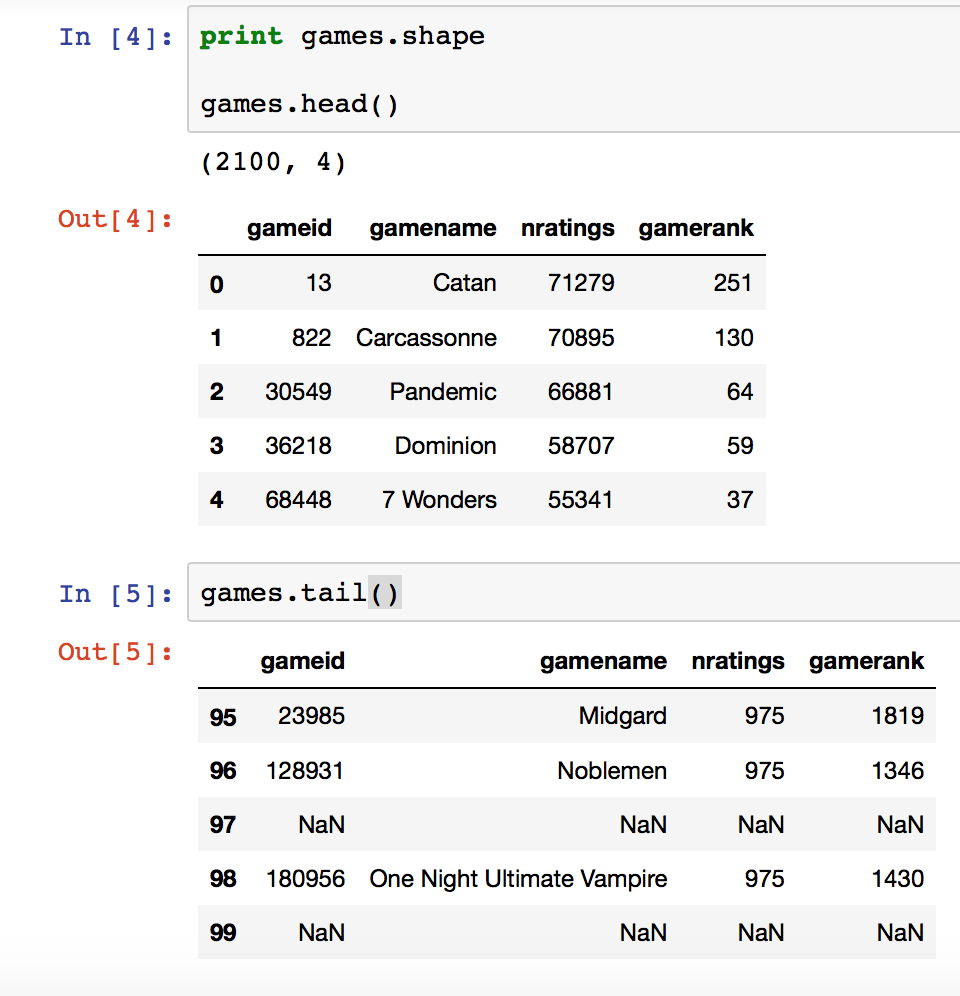
Looking at the head of our games dataframe, you can see that the most popular games have ratings in the high tens of thousands.
We see rows of NaNs in the bottom of our dataframe however, which actually corresponds to game expansions. It was created when we analyzed for a game rank in our try/except block in the code above, moving past the entry if it does not have a rank. Expansions do not have ranks on BGG but people are able to rate them.
We will not be including expansions in our analysis as recommending an expansion to someone who already likes the game is quite a no-brainer and is not useful as a recommendation.
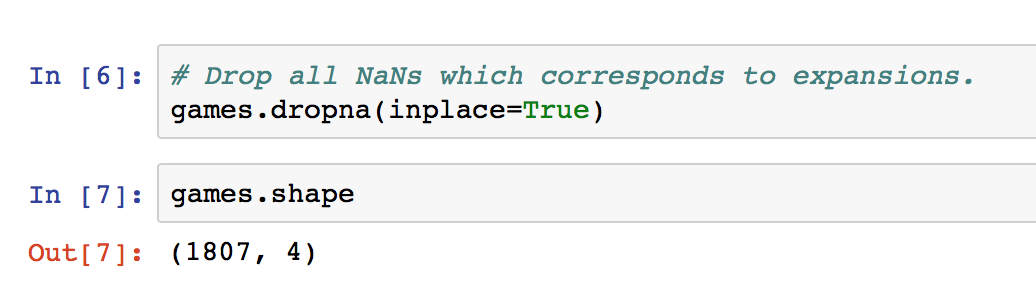
We have dropped a grand total of 293 expansions, leaving us with 1807 games
As the games dataframe was put together by concatenating several smaller dataframes together, the index will need to be reset. We write the gamelist to a csv file too for safekeeping
# Reset the index since we concatenated a bunch of DFs with the same index into one DF
games.reset_index(inplace=True, drop=True)
# Write the DF to .csv for future use
games.to_csv("bgg_gamelist.csv", index=False, encoding="utf-8")
By adding over the total number of ratings column in our dataframe, there should be a total of 8,028,799 ratings that we need to collect. We will do so via API calls to the BGG database to form our ratings matrix.
Making API calls to build our ratings list
With our list of games and their associated ids, we can dive deeper into looking at the ratings for each game as well as who rated them. BGG provides an XML API where we can get the info we need.
As it is, each call to the BGG API only returns a page of 100 ratings for each game. We will thus need to loop through each page for each game till we extract all the ratings from each game.
Our approach is to make calls for each full page of 100 ratings first, followed by acquiring the last page of partial ratings separately.
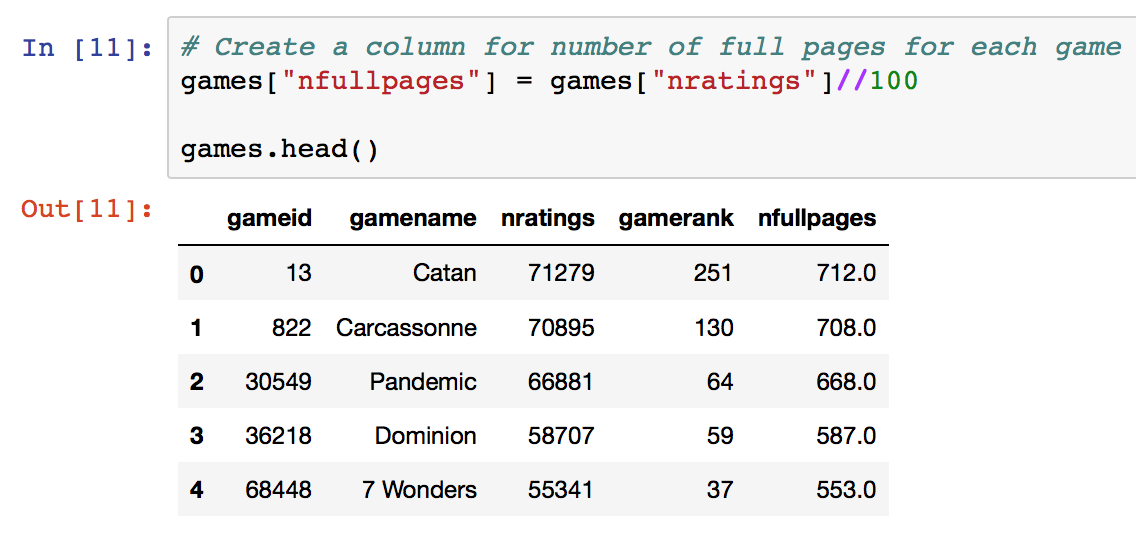 Addition of a column detailing number of full pages of 100 ratings to make API calls to
We next create a database to store all our gathered ratings in
# Create the database and make a cursor to talk to it.
import sqlite3
connex = sqlite3.connect("bgg_ratings.db")  # Opens file if exists, else creates file
cur = connex.cursor()
The next chunk of code makes API calls to the server and retrieves ratings in groups of 150 games. This is possible because of how the url is structured.
#############################################################
# Gathering all ratings from all games in data set
#############################################################
# Get ratings page-by-page for all games, but do it in chunks of 150 games
for nm, grp in games.groupby(np.arange(len(games))//150):
    # Initialize a DF to hold all the responses for this chunk of games
    df_ratings = pd.DataFrame(columns=["gameid", "username", "rating"], index=range(grp["nratings"].sum()+100000))

    # Initialize indices for writing to the ratings dataframe
    dfidx_start = 0
    dfidx = 0

    # For this group of games, make calls until all FULL pages of every game have been pulled
    pagenum = 1
    while len(grp[grp["nfullpages"] > 0]) > 0:
        # Get a restricted DF with only still-active games (have ratings pages left)
        active_games = grp[grp["nfullpages"] > 0]

        # Set the next chunk of the DF "gameid" column using the list of game IDs
        id_list = []
        for game in active_games["gameid"]:
            id_list += [game]*100
        dfidx_end = dfidx_start + len(active_games)*100
        df_ratings.iloc[dfidx_start:dfidx_end, df_ratings.columns.get_loc("gameid")] = id_list

        # Make the request with the list of all game IDs that have ratings left
        id_strs = [str(gid) for gid in active_games["gameid"]]
        gameids = ",".join(id_strs)
        sleep(1.5)  # Keep the server happy
        r = request("http://www.boardgamegeek.com/xmlapi2/thing?id=%s&ratingcomments=1&page=%i" % (gameids, pagenum))
        soup = BeautifulSoup(r.text, "xml")
        comments = soup("comment")

        # Parse the response and assign it into the dataframe
        l1 = [0]*len(active_games)*100
        l2 = [0]*len(active_games)*100
        j = 0
        for comm in comments:
            l1[j] = comm["username"]
            l2[j] = float(comm["rating"])
            j += 1
        df_ratings.iloc[dfidx_start:dfidx_end, df_ratings.columns.get_loc("username")] = l1
        df_ratings.iloc[dfidx_start:dfidx_end, df_ratings.columns.get_loc("rating")] = l2


        grp["nfullpages"] -= 1  # Decrement the number of FULL pages of each game id
        dfidx_start = dfidx_end
        pagenum += 1
        print("pagenum updated to %i" %(pagenum,))

    # Strip off the empty rows
    df_ratings = df_ratings.dropna(how="all")
    # Write this batch of all FULL pages of ratings for this chunk of games to the DB
    df_ratings.to_sql(name="ratings", con=connex, if_exists="append", index=False)
    print("Processed ratings for batch #%i of games." % (nm))
That will take quite a while, couple of days in fact. If you can still recall, we still have one more page of ratings for each that game for which we have not made our API calls to.
#############################################################
# Request the final partial page of ratings for each game
#############################################################
# Restore the correct number of FULL pages
games["nfullpages"] = games["nratings"]//100

# Initialize a DF to hold all the responses over all the chunks of games
temp_ratings = pd.DataFrame(columns=["gameid", "username", "rating"], index=range(len(games)*100))

# Initialize indices for writing to the ratings dataframe
dfidx_start = 0
dfidx = 0

# Loop through game-by-game and request the final page of ratings for each game
for idx, row in games.iterrows():
    # Get the game ID and the last page number to request
    pagenum = row["nfullpages"] + 1
    gameid = row["gameid"]

    # Make the request for just the last page of ratings of this game
    sleep(1)  # Keep the server happy
    r = requests.get("http://www.boardgamegeek.com/xmlapi2/thing?id={}&ratingcomments=1&page={}".format(gameid, pagenum))
    while r.status_code != 200:
        sleep(2)  # Keep the server happy
        print("Server Error! Response Code %i. Retrying..." % (r.status_code))
        r = requests.get("http://www.boardgamegeek.com/xmlapi2/thing?id=[]&ratingcomments=1&page={}".format(gameid, pagenum))
    soup = BeautifulSoup(r.text, "xml")
    comments = soup("comment")

    # Set the next chunk of the DF "gameids" column with this gameid
    id_list = [gameid]*len(comments)
    dfidx_end = dfidx_start + len(comments)
    temp_ratings.iloc[dfidx_start:dfidx_end, temp_ratings.columns.get_loc("gameid")] = id_list

    # Parse the response and assign it into the dataframe
    l1 = [0]*len(comments)
    l2 = [0]*len(comments)
    j = 0
    for comm in comments:
        l1[j] = comm["username"]
        l2[j] = float(comm["rating"])
        j += 1
    temp_ratings.iloc[dfidx_start:dfidx_end, temp_ratings.columns.get_loc("username")] = l1
    temp_ratings.iloc[dfidx_start:dfidx_end, temp_ratings.columns.get_loc("rating")] = l2

    dfidx_start = dfidx_end   # Increment the starting index for next round

    if idx%100 == 0:
        print("Finished with a chunk of 100 games.")

# Strip off the empty rows
temp_ratings = temp_ratings.dropna(how="all")

# Write this final batch of all partial pages of ratings for this chunk of games to the DB
temp_ratings.to_sql(name="ratings", con=connex, if_exists="append", index=False)
With all the ratings in hand, the last thing to do is to close the database connection and save it.
# Save our changes and close the connection
connex.commit()
connex.close()
Preprocessing the ratings dataframe
With our ratings data stored in a database, we can start analyzing this table and perform some EDA
# Opens db file
connex = sqlite3.connect("bgg_ratings.db")
# Get everything to see what we have first
sql = "SELECT * FROM ratings"
ratings = pd.read_sql(sql, con=connex)
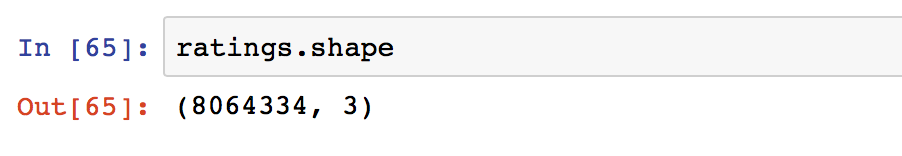
Looks like a lot more rows than what was calculated previously from the sum of the nratings column (8,028,799)
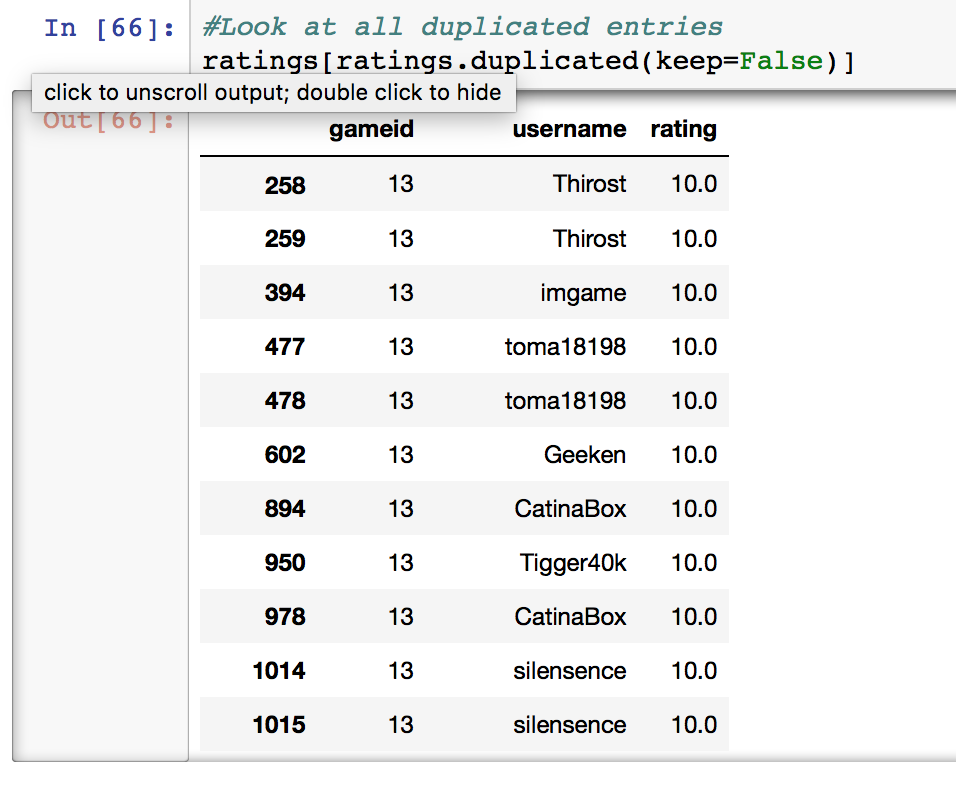
There seems to be repeated rows in our dataset. This is because users are able to rate different versions of the game. Versions could be differentiated by language or by edition through subsequent printings by either the same or different publishers. If a user chooses to add more versions of a game to their collection, they have the option of attributing the same rating to each copy. Choosing to rate the game separately will result in duplicated rows if they choose to rate the games at the same score.
# Drop all duplicates
ratings = ratings.drop_duplicates()
After dropping all duplicates, we observe that the number of ratings has been reduced to 8,029,041, about 249 entries more than previously calculated.
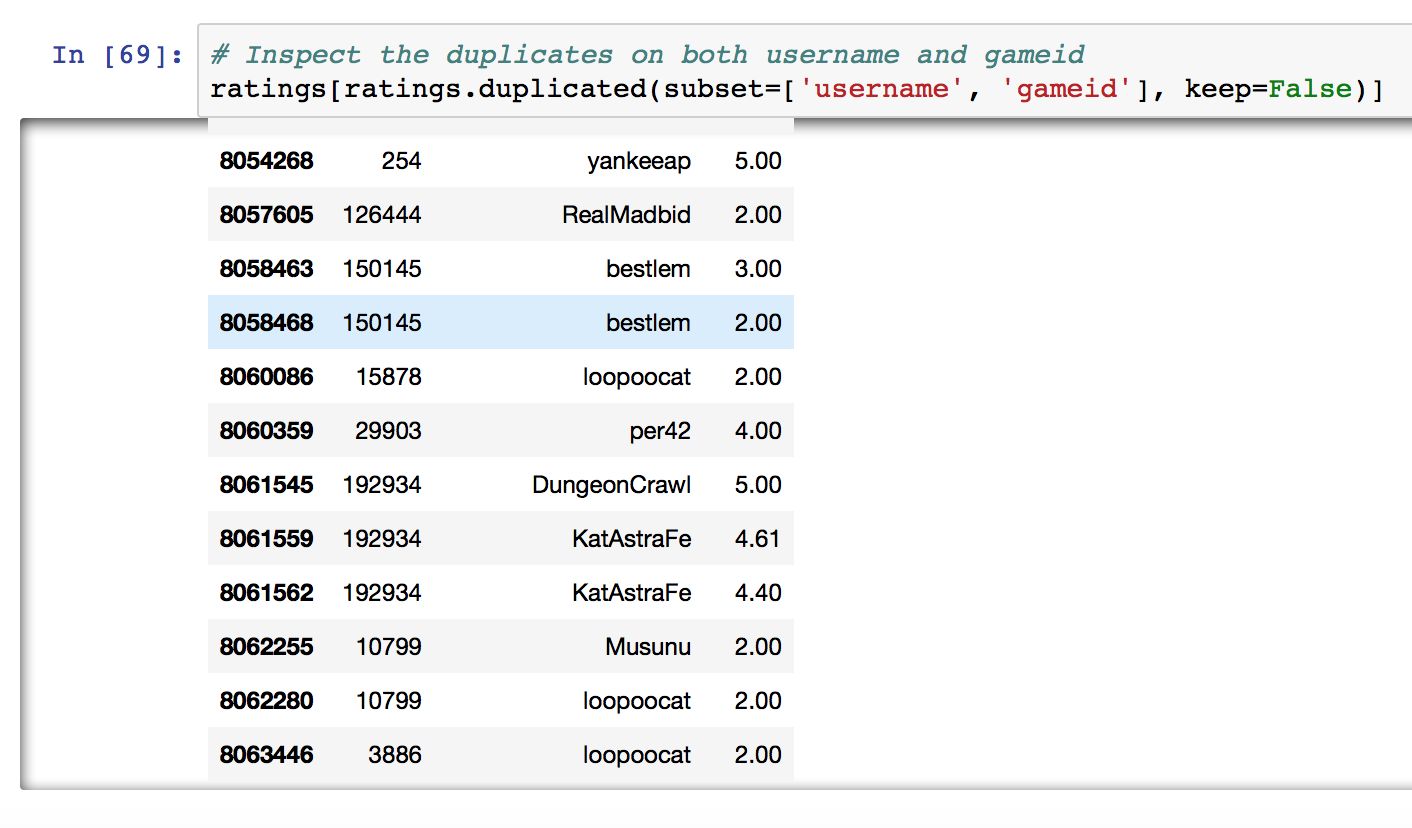
We can see the reason for the duplicates is due to the same user rating the same game twice or more. This can happen when a user adds a new version / edition of the game to his collection and gives it a different rating. Or like the example below, just can’t make up his mind.
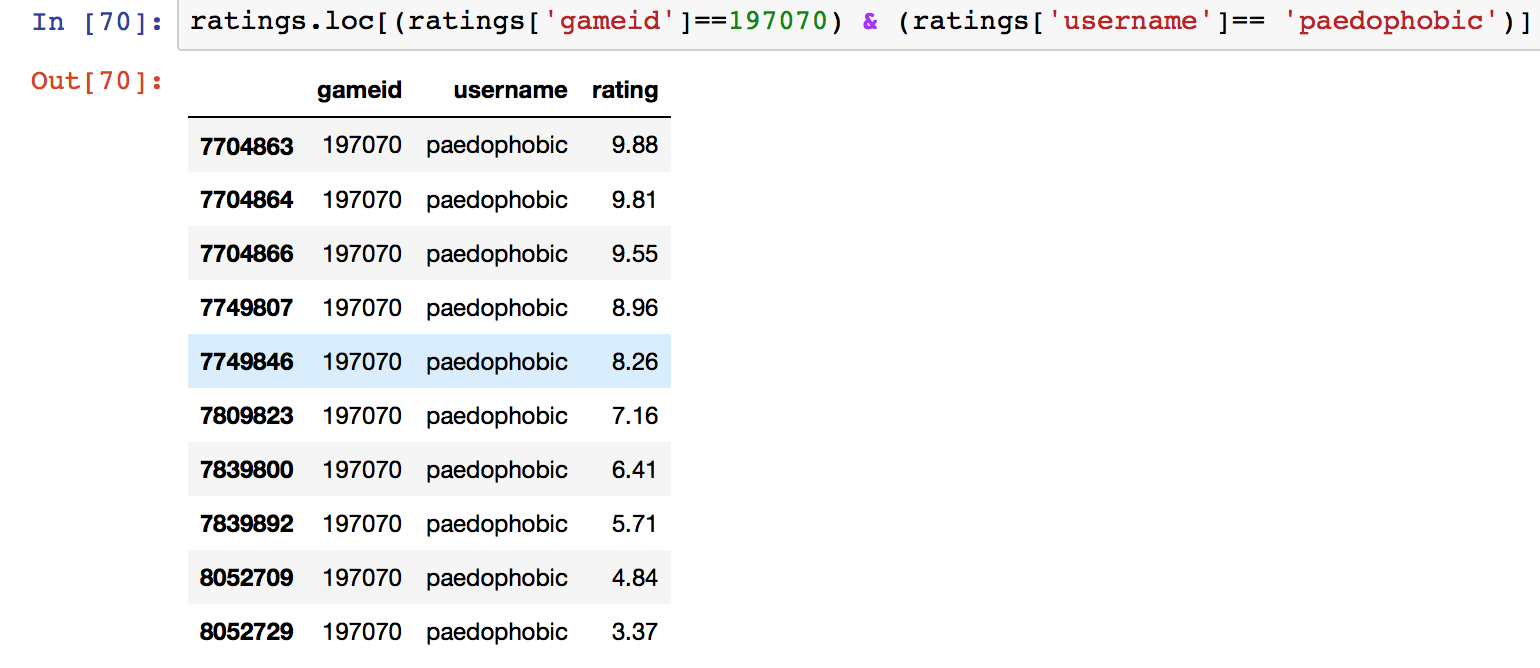
Unfortunately, we have no timestamp data of when the ratings were given. The next best alternative is to compute the mean of the set of ratings that each user gives to the same game since the ratings are continuous variables on a scale of 1-10
# rows where (game, user) is duplicate
multis = ratings.loc[ratings.duplicated(subset=["gameid", "username"], keep=False)]
# rows where (game, user) is NOT duplicate
no_multis = ratings.loc[~ratings.duplicated(subset=["gameid", "username"], keep=False)]
# replace each set of duplicates with avg
means = multis.groupby(["gameid", "username"])["rating"].mean().reset_index()
means.head()
# Add the de-duplicated average rows back in
ratings = pd.concat([no_multis, means])
#Check for duplicates
ratings.duplicated(subset=['gameid', 'username']).sum()
The final results shows that we have no more duplicate results in our dataset. Let’s save it as a separate database.
connex = sqlite3.connect("bgg_ratings_deduplicated.db")
ratings.to_sql("ratings", connex, index=False)
connex.commit()
connex.close()
Transforming into a ratings matrix and EDA
We will want to pivot our ratings matrix into a table of size N x M where N is the total number of users as rows and M is the total number of games as columns. The values in the matrix will be populated by the ratings given by each user to games.
We will also select users with at least 10 or more ratings in our database in order to make our predictions and recommendations. We do so first with an SQL statement into our deduplicated ratings database.
# Select users with at least 10 or more ratings into a new dataframe
connex=sqlite3.connect("bgg_ratings_deduplicated.db")
sql="""
SELECT username, COUNT(username) as games_rated
FROM ratings
GROUP BY username
HAVING games_rated >= 10
"""
users = pd.read_sql(sql, connex)
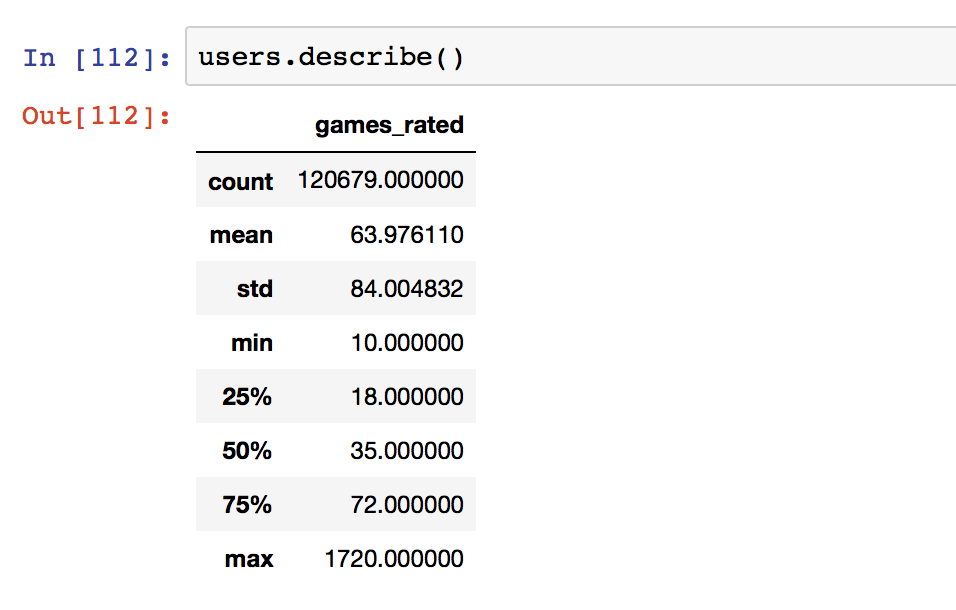
The median number of games rated is 35 while the mean is around 64. There seems to be a few individuals that rate so many games that it skews the distribution. The max number of games rated by one or more individuals is 1720 out of a possible 1807 games!
 kudos to you sir!
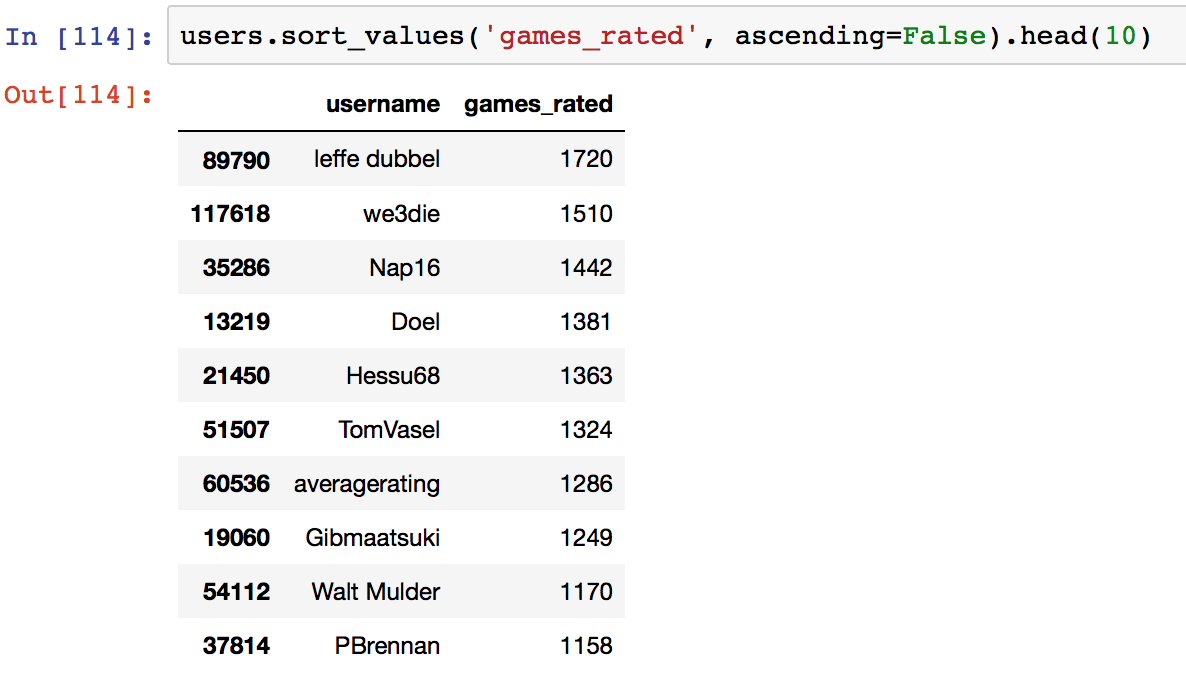
Looks like there is only one individual with the honour of rating the most games in our dataset.
We now turn our attention towards the distribution of ratings via histogram plot
plt.figure(figsize=(12,8))
sns.distplot(users['games_rated'], bins=20, kde=False)
sns.despine()
plt.show()
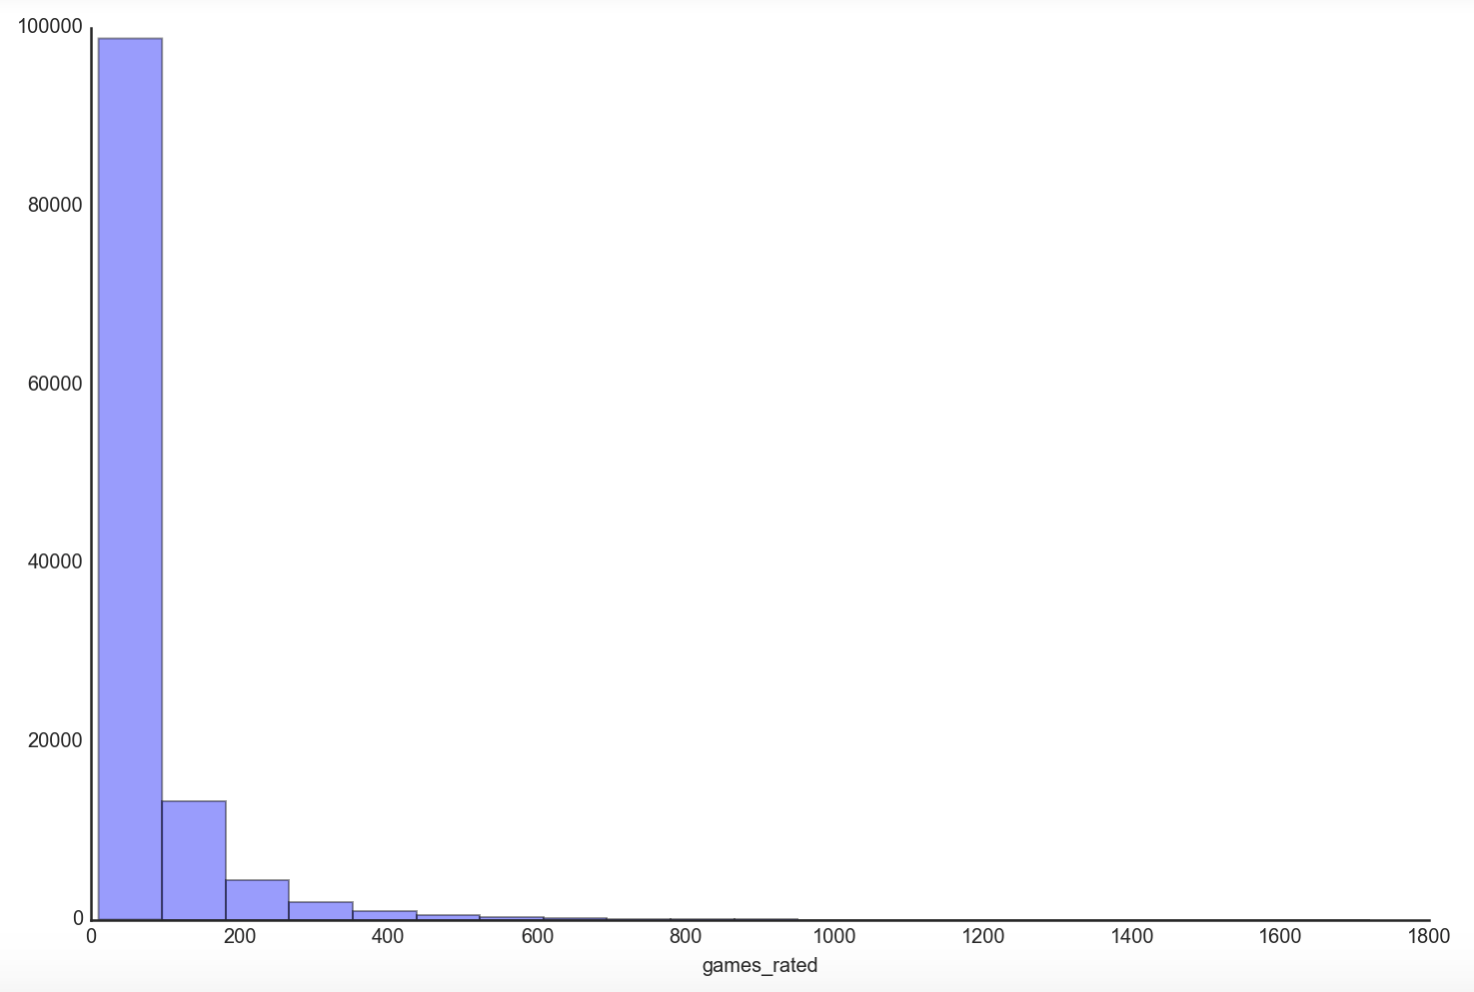
We can see that the majority of users rate 100 games or less, making the distribution significantly positively skewed by the few individuals that rate games in the thousands. How about our games database? How does the distribution look like?
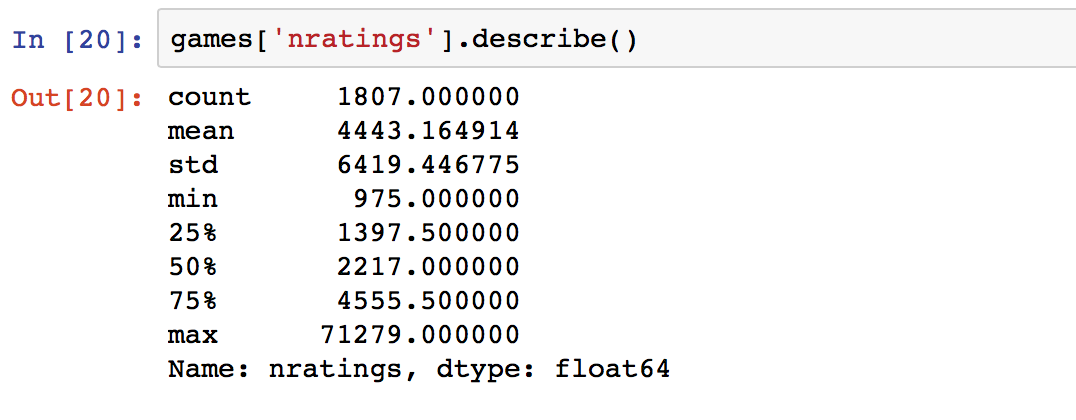
The mean of 4443 and median of 2217 seems to suggest a highly skewed distribution as well. The max of 71279 and min of 975 perfectly sums up why.
plt.figure(figsize=(12,8))
sns.distplot(games['nratings'], bins=20, kde=False)
sns.despine()
plt.show()
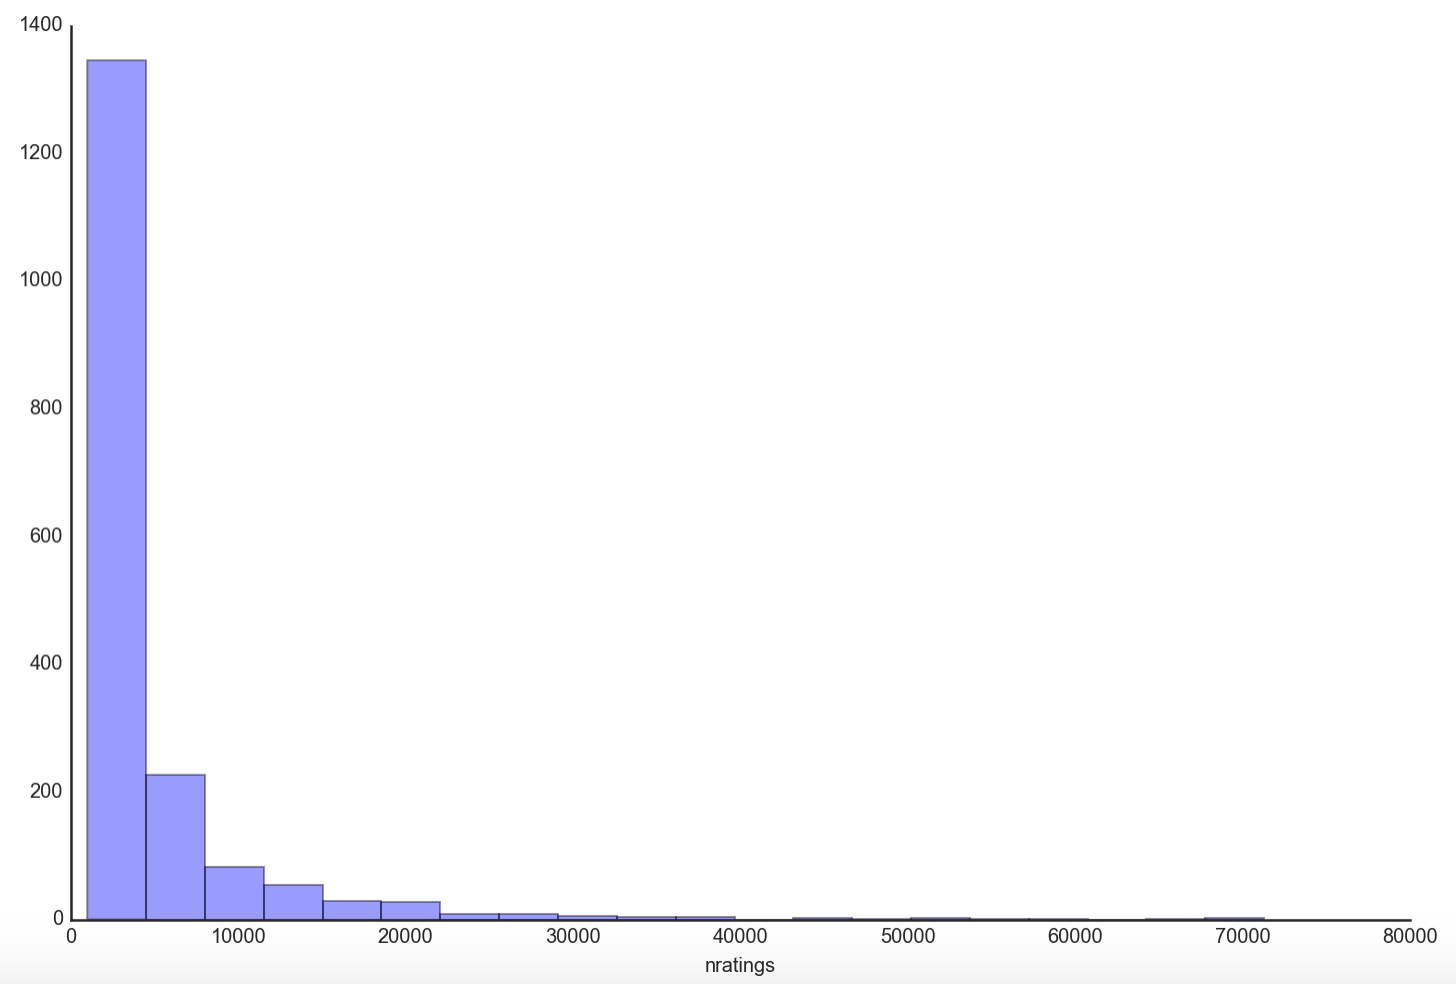
The distribution of game ratings looks eerily similar to that of the rating distribution of users. This is not surprising given some games are more popular than others and yet the vast majority of games have few ratings compared to a minority of popular ones that gets exponentially more ratings just because they are more well-known.
With our users dataframe, we will now select a subset from our ratings dataset of users that have rated at least 10 games.
rate10 = ratings[ratings['username'].isin(users['username'])]
rate10['username'].nunique()
120679
Seems like we are left with 120,679 users in our shrunken dataset. How sparse will the ratings matrix be actually?
max_n_ratings = len(rate10["gameid"].unique())*len(rate10["username"].unique())
actual_n_ratings = len(rate10)
print 'Number of possible values in ratings matrix:', max_n_ratings
print 'Number of actual ratings:', actual_n_ratings
print "Density of Ratings Data is {:.2f}".format(100*float(actual_n_ratings)/max_n_ratings)

Number of possible values in ratings matrix: 218066953
Number of actual ratings: 7720573
Density of Ratings Data is 3.54
The density of the ratings matrix is about 3.54% with about 96.45% of it covered with NaN values. It is our job to predict what those NaN values are and sort these predicted values in descending order to recommend games to each user based on their current ratings.
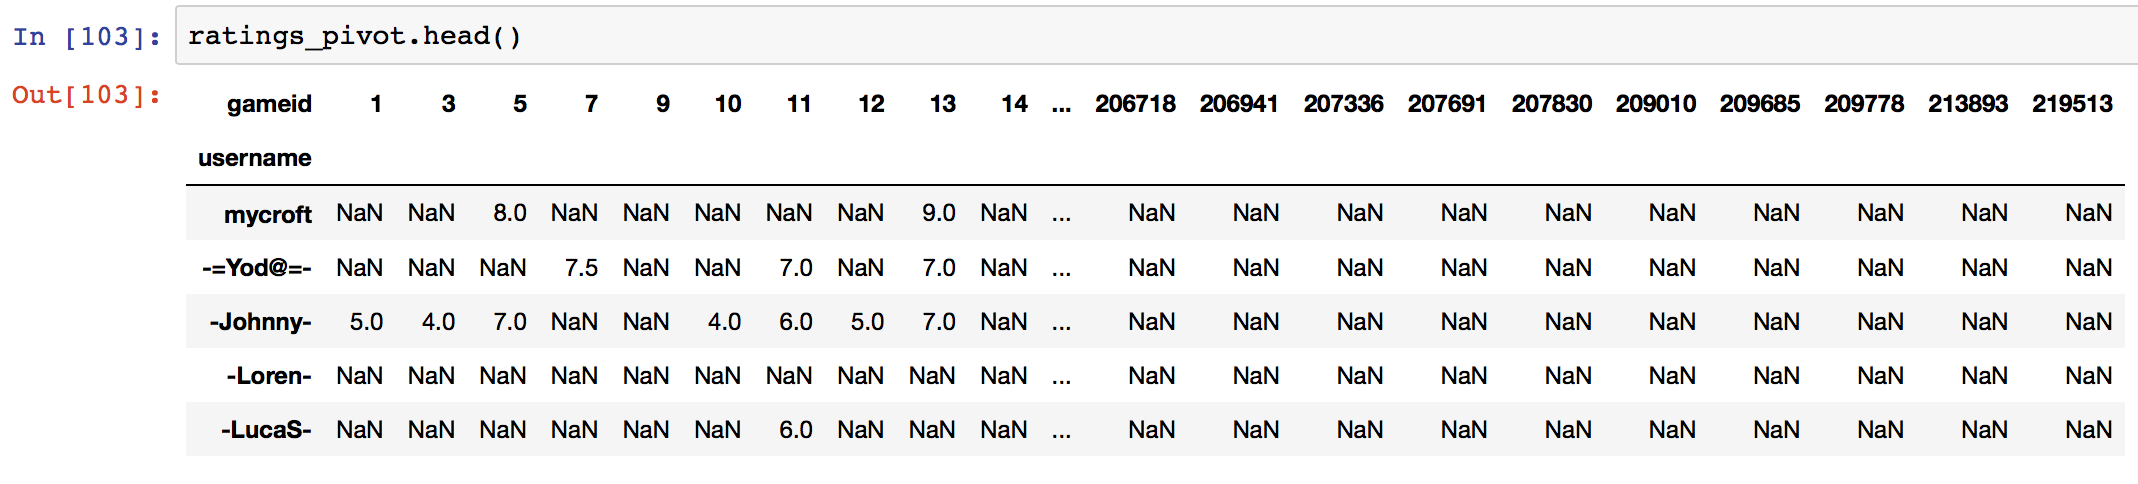
Finally, we transform our long ratings dataframe into a wide format through a pivot_table, not forgetting to pickle the file right at the end for use in the next part, modeling and predictions.
ratings_pivot = pd.pivot_table(rate10, values='rating', index='username', columns='gameid')
ratings_pivot.shape

(120679, 1807)
Let’s do one final EDA and explore the rating habits of the users in our dataset using this newly acquired ratings matrix.
user_ratings_mean = np.mean(ratings, axis=1)
overall_mean = np.mean(user_ratings_mean)
#Plot of average user rating
plt.figure(figsize=(12,8))
sns.distplot(user_ratings_mean, kde=False)
sns.despine()
plt.xlabel('Rating value')
plt.ylabel('Frequency')
plt.show()
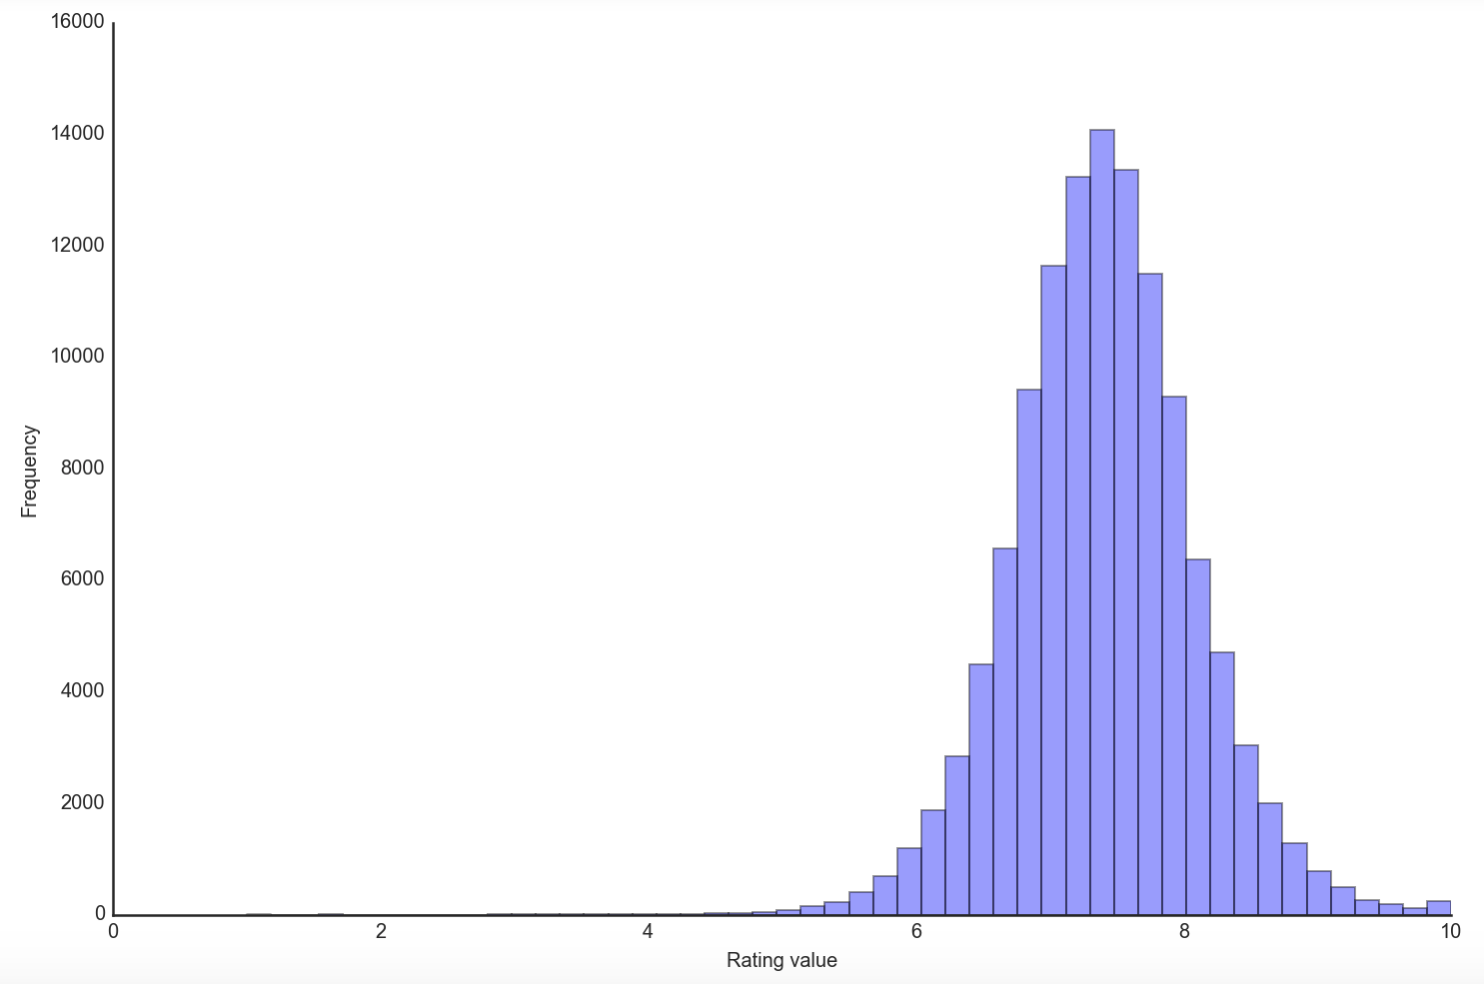
The mean ratings of all our users follow a normal distribution with most users giving an average rating between 7 and 8. The actual mean rating given is about 7.4. This suggests that most users tend to like the games they play, assuming they follow the ratings rubric suggested by the website. There are users that have mean ratings as high as 10 but very few with mean ratings less than 5. We will need to normalize their ratings in order to make comparisons in the next step.
Before we forget,
ratings_pivot.to_pickle('ratings_pickle')
rate10.to_pickle('rate10_pickle')
Summary
In this first part of 3, I explained why I chose to create a recommender system for users on Boardgamegeek.com, how I scraped and did API calls to generate my gamelist and ratings matrix and how I preprocessed the data to perform EDA on.
Coming up
We take our ratings matrix and put it through some serious work with the sole purpose of filling up all those NaNs with solid predictions. We will look at neighborhood as well as latent factor methods and perform offline evaluations on 3 algorithms. Onward!
This is part 1 of a 3 part series on building a board game recommender system for Boardgamegeek.com users. Part 2, where we model and predict the recommendations can be found here. Part 3, where we build a web app and collect online evaluations can be found here.
The accompanying ipython notebook can be found in the following Github repo.